
IRENA: Updated Renewable Energy Statistical Yearbook 2022, Wind Energy Accounts for 21%
2022.07.27
CWEA
The data in the Yearbook comes from a variety of sources, including the IRENA questionnaire, official statistics from various countries, reports from industry associations, reports from relevant consultants, and news articles. The Renewable Energy Digest accompanying the report provides an overview of key trends in the global renewable energy industry.
The new yearbook also includes statistics on renewable energy investments, drawn from the OECD-DAC database and 20 major multilateral, bilateral and national development finance institutions, covering the period 2011-2020. Investment figures are calculated in millions of dollars at 2020 prices.
Renewable energy capacity data (capacity) represents the maximum net capacity of power plants and other facilities that use renewable energy to generate electricity. For most countries and technologies, these figures reflect installed and grid-connected capacity as of the end of the calendar year.
Capacity is expressed in megawatts (MW), while electricity generation is expressed in gigawatt-hours (GWh, gigawatt hours). Pumped hydro is only included in hydropower data, but not in total renewable energy.
Data sets of generation and installed capacity from 2000 onwards can be accessed through the IRENA official Data and Statistics page.
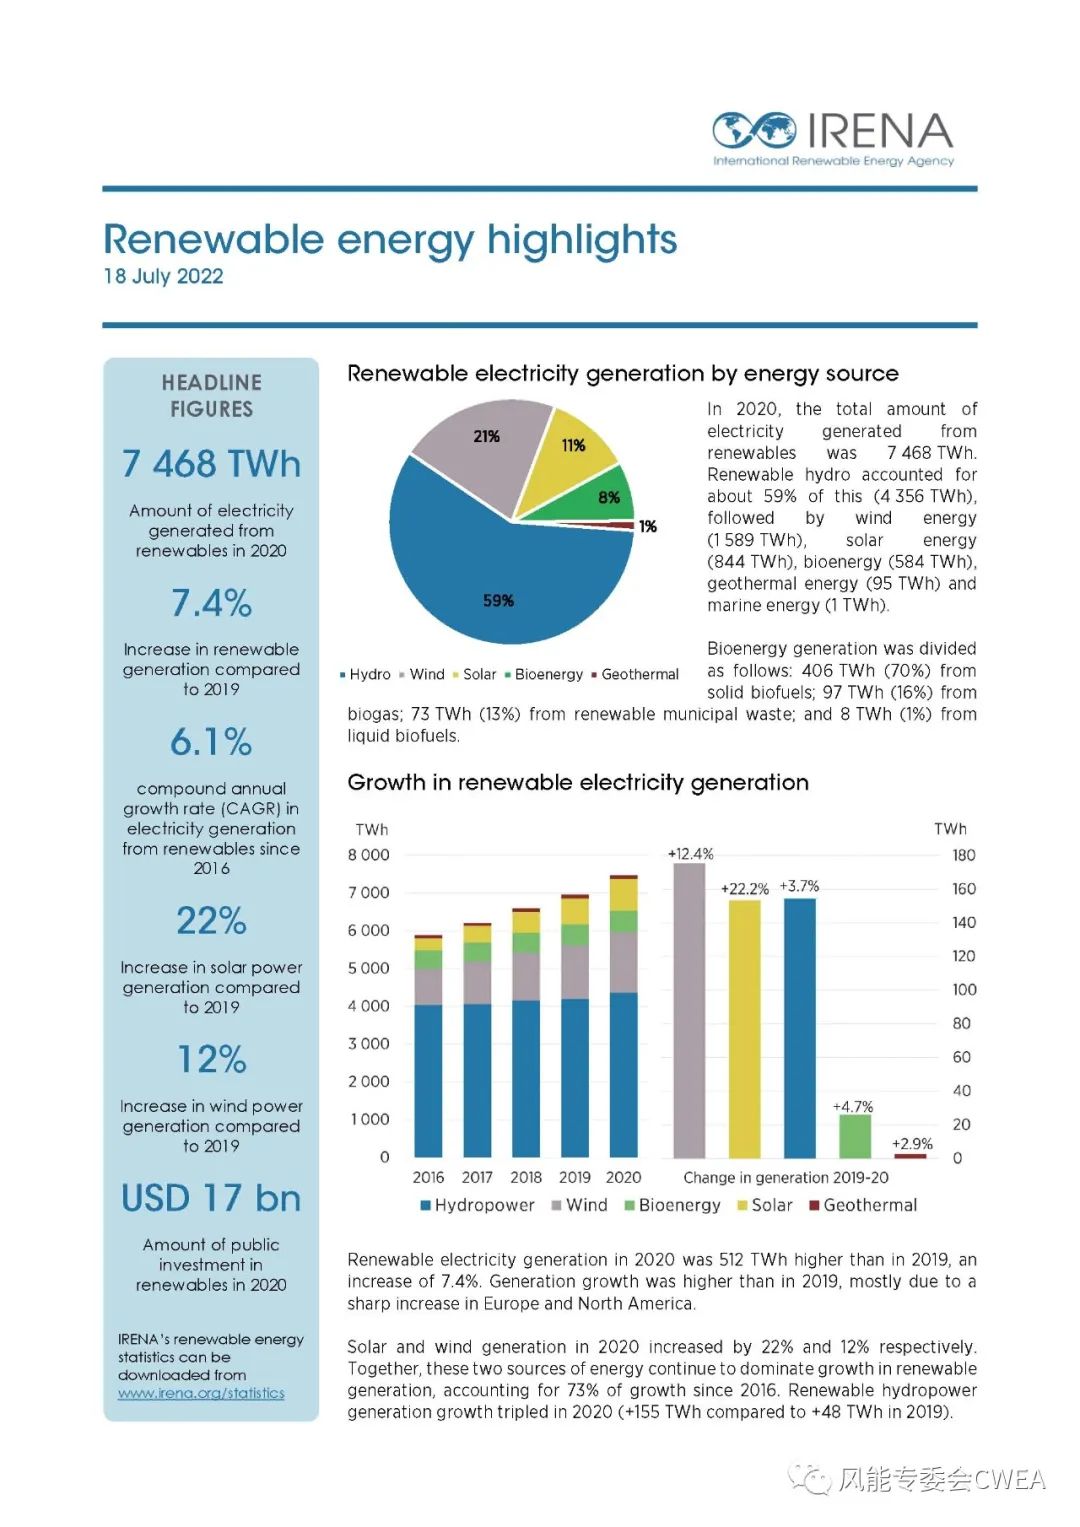
Key figures: Renewable energy generation in 2020 was 7,468TWh, up 7.4% from 2019, with a CAGR of 6.1% since 2016, solar power generation up 22% from 2019, wind power generation up 22% from 2019, and total public investment in renewable energy in 2020 was $17 billion.
Proportion of renewable energy generation:
In 2020, the total amount of electricity generated from renewable sources was 7468 TWh.
Hydropower accounted for about 59% (4,356 TWh), followed by wind (1,589 TWh), solar (844 TWh), biomass (584 TWh), geothermal (95 TWh) and ocean (1 TWh).
The distribution of biomass power generation is as follows: 406 TWh (70%) from solid biofuels; 97 TWh (16%) from biogas; 73 TWh (13%) from renewable municipal waste; 8 TWh (1%) from liquid biofuels.
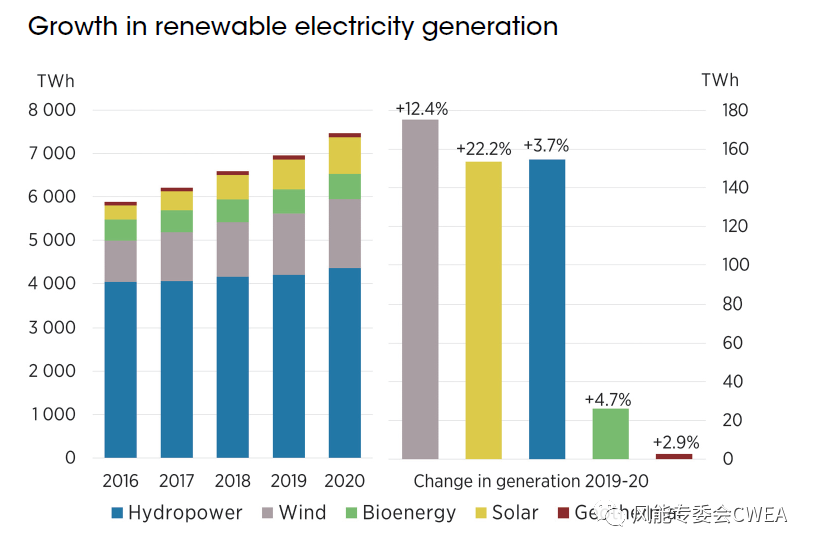
Renewable energy generation increased by 512 terawatt hours (TWh) in 2020 compared to 2019, an increase of 7.4%. The increase in power generation was higher than in 2019, mainly due to sharp increases in Europe and North America.
In 2020, solar and wind power generation grew by 22% and 12%, respectively. Together, these two energy sources continue to dominate the growth of renewable energy generation, accounting for 73% of the increase since 2016. Hydropower is growing rapidly, tripling in 2020 (+155 TWh compared to +48 TWh in 2019).
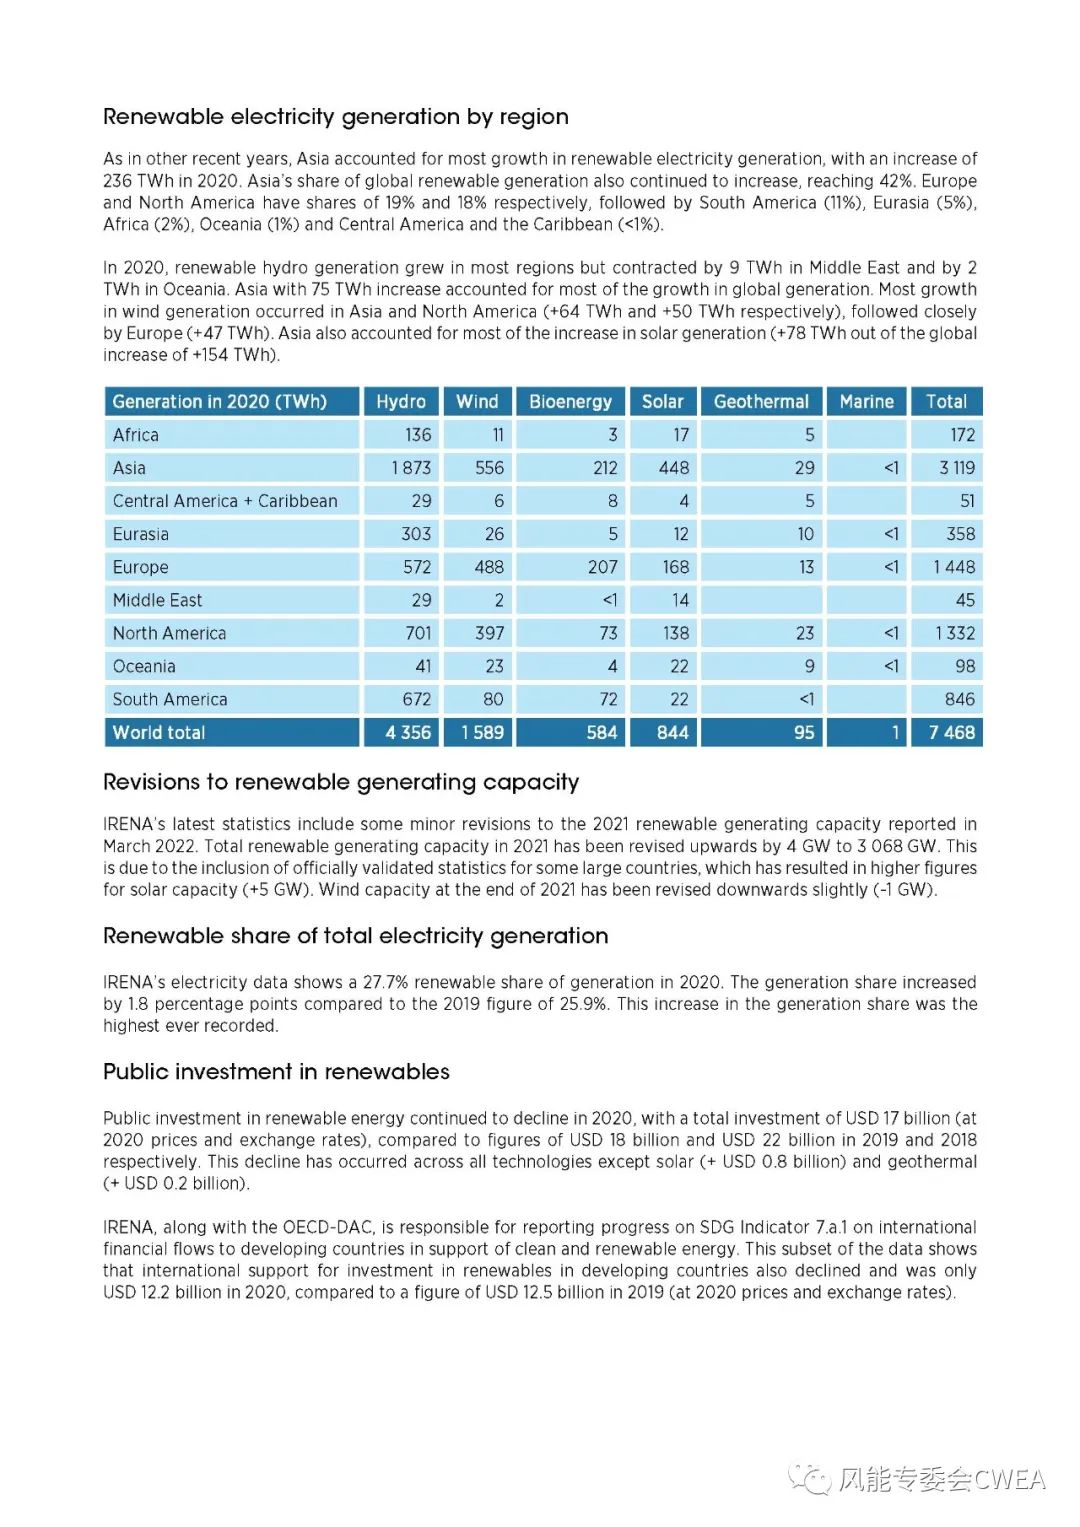
Renewable energy generation by region.
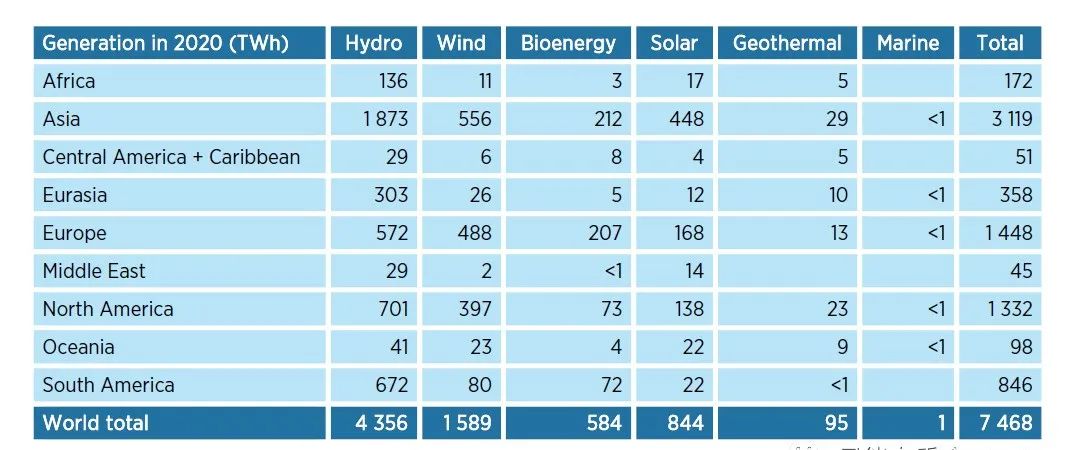
Asia, as in other years, saw the largest growth in renewable energy generation, adding 236 TWh in 2020. Asia's share of global renewable energy generation also continues to increase, reaching 42%.
Europe and North America have a share of 19% and 18%, respectively, followed by South America (11%), Eurasia (5%), Africa (2%), Oceania (1%), and Central America and the Caribbean (<1%) )。
In 2020, renewable hydropower generation increased in most regions, but it decreased by 9 TWh in the Middle East and 2 TWh in Oceania. Asia added 75 TWh, accounting for most of the global growth in electricity generation.
Most of the growth in wind power is taking place in Asia and North America (+64 TWh and +50 TWh, respectively), followed by Europe (+47 TWh). Asia also accounted for the bulk of the increase in solar power generation (+78 TWh out of the global increase of +154 TWh).
Revisions to renewable energy generation volumes
IRENA's latest statistics include some minor revisions to 2021 renewable energy generation reported in March 2022. Total renewable energy generation was revised up by 4 GW to 3,068 GW in 2021. This is due to the inclusion of official verification statistics from some large countries, which has led to an upward adjustment of 5 GW in solar generation figures. By the end of 2021, the installed wind capacity had been slightly reduced by 1GW.
The share of renewables in total electricity generation
IRENA electricity data shows that the share of renewable energy generation in 2020 was 27.7%. The share of electricity generation increased by 1.8 percentage points compared to 25.9% in 2019. The growth in the share of electricity generation is the highest ever.
Public investment in renewable energy
Public investment in renewable energy continued to decline in 2020, with a total investment of $17 billion (at 2020 prices and exchange rates), compared to $18 billion in 2019 and $22 billion in 2018. With the exception of solar (+$800 million) and geothermal (+$200 million), all technologies are on a downward trend.
Together with the OECD-DAC, IRENA is responsible for reporting on progress towards SDG indicator 7.a.1, which is the flow of international finance to developing countries to support clean and renewable energy. This part of the data shows that international support for renewable energy investment in developing countries has also declined, reaching only $12.2 billion in 2020 compared to $12.5 billion in 2019 (at 2020 prices and exchange rates).
Related testimonials

Start with the Red Sea! Wind power retirement market pains
2025.06.25

China's installed wind and solar capacity has historically surpassed that of thermal power
2025.04.28

Breakthroughs have been made in the challenges of customization and high precision, and new progress has been made in the intelligent production of high-end equipment
2025.03.24


0 comments