
Caption | China accounts for 65% of the world's renewable energy manufacturing capacity!
2023.04.03
Wind Energy Committee CWEA
According to the International Energy Agency's (IEA) Energy Technology Outlook 2023 report, the data visualization website Virtual Capitalist shows the distribution of global production capacity of various clean energy technologies in various countries and regions in the form of an infographic, including: offshore wind, onshore wind, solar photovoltaics, electric vehicles, fuel cell trucks, heat pumps and electrolyzers.
In the figure below, the red one shows China's clean energy capacity. For mature renewable energy technologies, including offshore wind power, onshore wind power, solar energy, electric vehicles and other links in the industrial chain, the production capacity accounts for more than 50%, especially some modules, such as solar silicon wafers, accounting for as much as 96%, accounting for an absolute advantage. The production capacity of offshore wind turbine blades was affected by China's rush to install offshore wind power in 2021, with 84% of the blades made in China. This year, 14.48GW of new offshore wind power was lifted in China, accounting for more than 80% of the world's total installed capacity. (Reference: According to the 2021 China Wind Power Hoisting Capacity Statistical Briefing, in 2022, the overall number of offshore wind power installations in China has declined, but due to the decrease in installed capacity in other countries around the world, this proportion has remained almost the same.) )
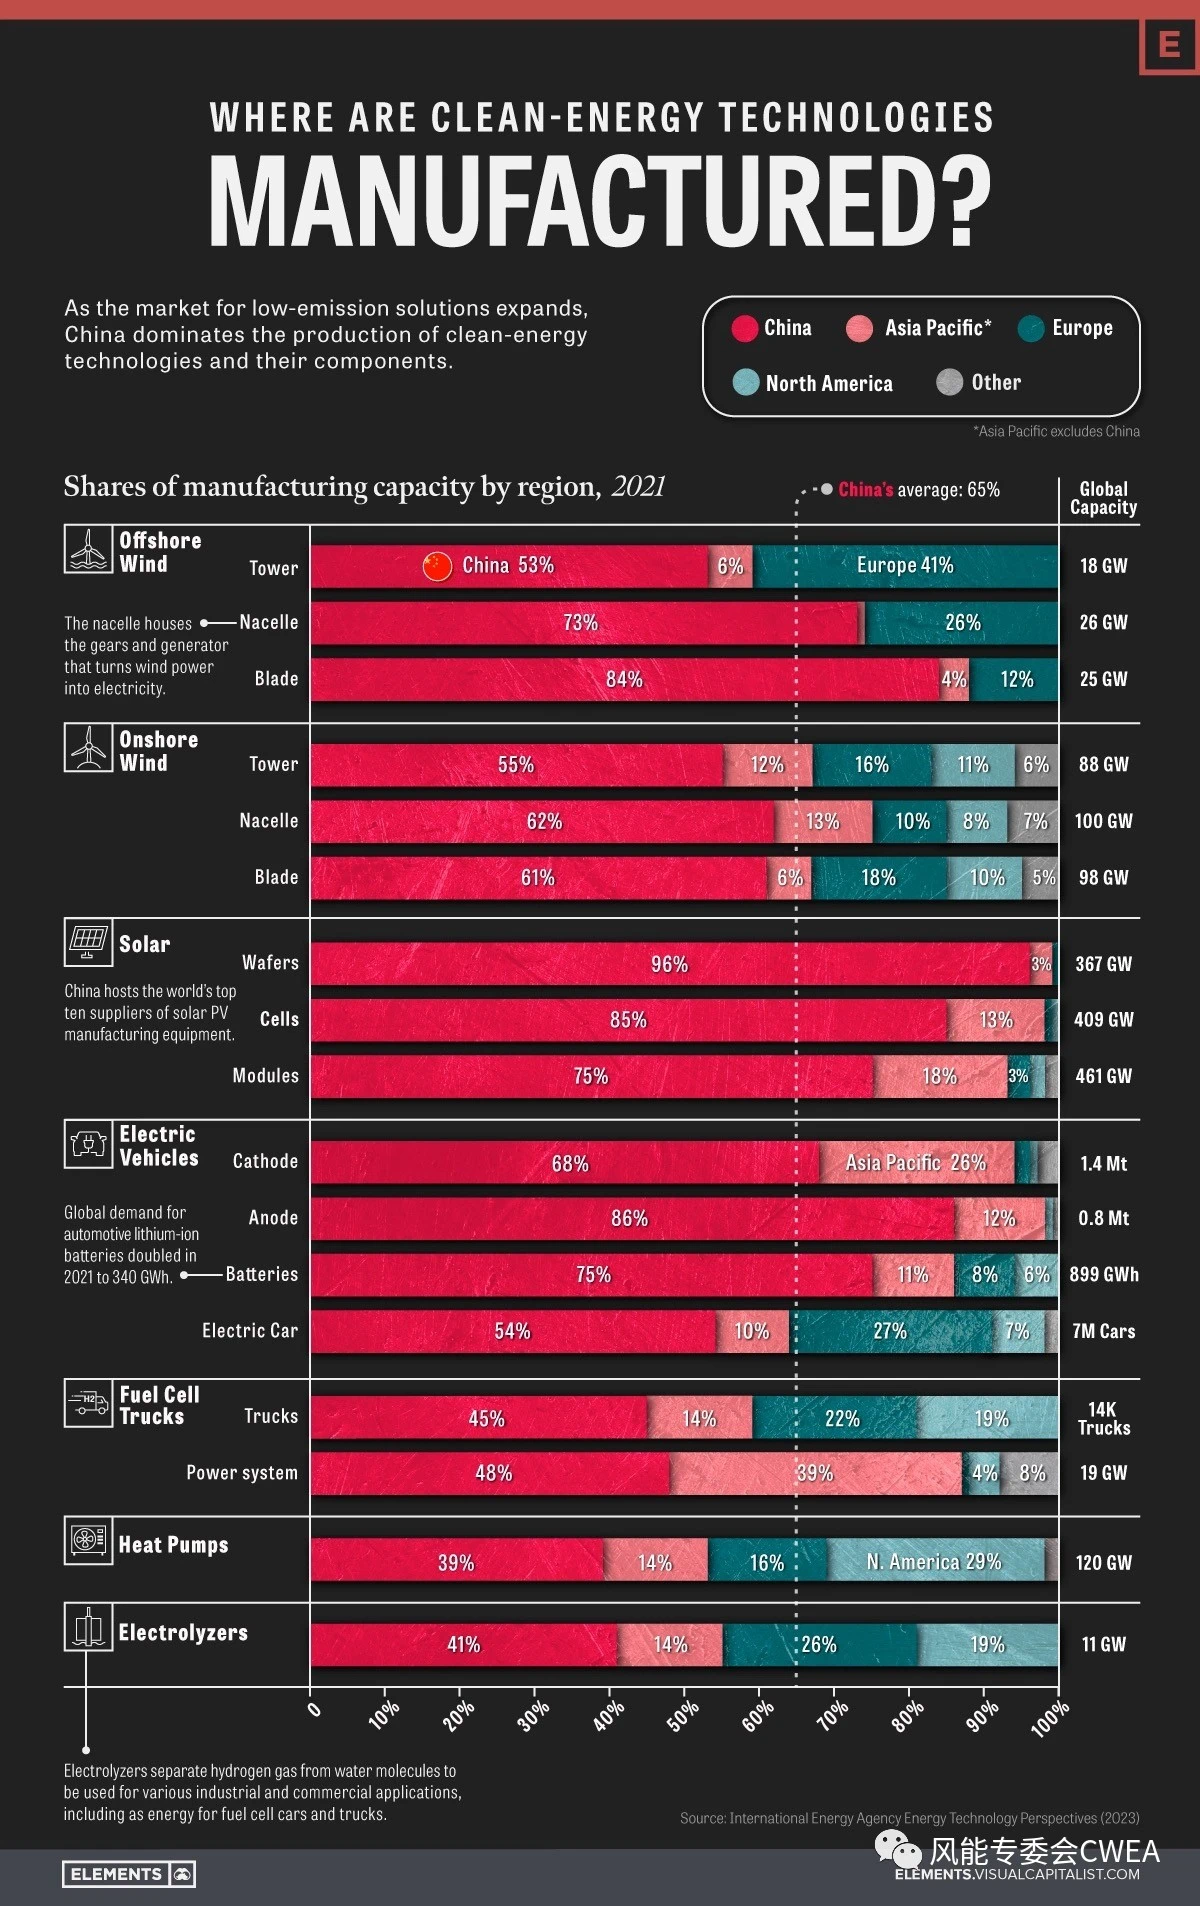

Distribution of China's share of global clean energy technology manufacturing capacity in 2021:
• Offshore power generation 70% (including towers 53%, nacelles 73%, blades 84%)
• Onshore wind 59% (including towers 55%, nacelles 62% and blades 61%)
• Solar PV 85% (Wafer 96%, Cell 85%, Module 75%)
• Electric vehicles 71% (cathode material 68%, cathode material 86%, power battery 75%, electric vehicle 54%)
• Fuel cell trucks 47% (45% for trucks, 48% for electric systems)
• Heat Pump 39%
• Electrolyzer 41%
Reference: IEA Flagship Report | Energy Technology Outlook 2023, Risks and Opportunities in the Clean Energy Technology Supply Chain
Related testimonials

CCTV Finance × Sany Heavy Industry: Infrastructure results are released! Anhui is soaring, and the equipment of the western port has become a "dark horse"
2025.05.19

China's installed wind and solar capacity has historically surpassed that of thermal power
2025.04.28

Breakthroughs have been made in the challenges of customization and high precision, and new progress has been made in the intelligent production of high-end equipment
2025.03.24


0 comments